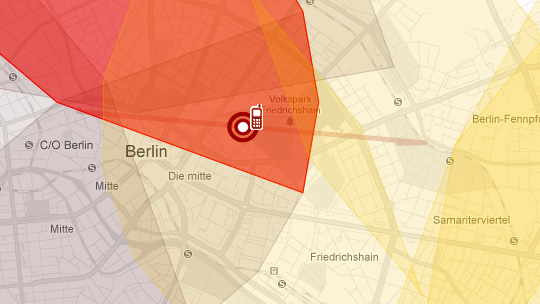
In my book, „What are you doing with my data?“ I sent dozens of information requests, as allowed under German law, to various public agencies and companies. As I explain in the book, these requests comprised the heart of my attempt to explore the „datafication“ of our everyday lives. In collaboration with Open Data City, I created a data visualization showing what data about me is still out there—some of this data is 18 years old! Each type of data collected (airline data, health records, police records) is represented by a colored dot in the graphic, and as a whole chapter in my book.
For the integration of the iframe in your pages (visualization under CC-BY 4.0) or to see the visualization in full screen mode: http://static.malte-spitz.de/book_en.html

